Design storms:
Design storms are key events for flood simulation, as they allow modeling extreme precipitation intensities over different durations and return periods. These design storms are essential for calculating the impact of extreme climate events on watersheds and for predicting potential flooding under high precipitation conditions.
The system incorporates globally pre-calculated design storms for various intensities and durations, based on 80 years of ERA5-LAND reanalysis data, a cutting-edge global dataset.
ERA5-LAND: Data for Design Storms
ERA5-LAND is a global dataset produced by the European Centre for Medium-Range Weather Forecasts (ECMWF), providing detailed atmospheric information over several decades. This dataset is used to perform robust temporal analyses of storm intensities and frequencies, offering a solid foundation for calculating design storms.
Key features of ERA5-LAND:
- Global coverage: Provides worldwide atmospheric data with a spatial resolution of approximately 31 km.
- Basis for design storm calculations: Enables precise analysis of extreme precipitation events using decades of historical data.
To calculate design storms, an extreme value analysis is applied to annual maximum precipitation data. This analysis identifies the most intense rainfall events over time and estimates their probability of occurrence in the future, which is essential for hydraulic infrastructure planning and flood risk assessment.
Precipitation Duration
Rainfall durations used range from 3 hours to 240 hours, covering a wide spectrum of precipitation events—from short, intense storms to long-duration events.
Return Periods
Precipitation data are modeled for return periods ranging from 2 years to 1,000 years, allowing simulation of rare but high-impact extreme rainfall events.
Note: Data for high return periods (such as 1,000 years) are extrapolated from available historical records, which may introduce uncertainties in the estimates. Caution is advised when using these data due to their higher uncertainty.
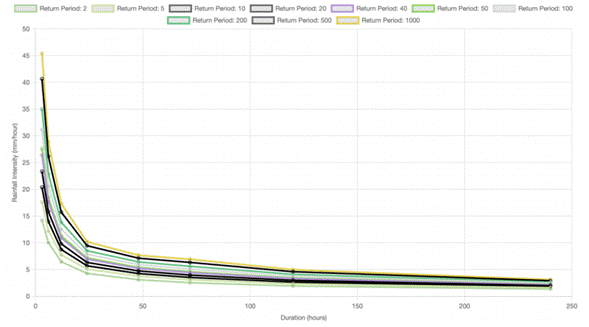
IDF Curves (Intensity-Duration-Frequency)
The system uses IDF curves to represent precipitation intensities as a function of duration and return period. An IDF curve shows how rainfall intensity changes over time and varies according to event frequency. The figure below illustrates an example of an IDF curve for a region, depicting the characteristics of different possible rainfall events.
Bibliography
ECMWF Reanalysis v5 (ERA5).. 2024. ECMWF. | https://www.ecmwf.int/en/forecasts/dataset/ecmwf-reanalysis-v5